Update 86: COVID-19 Testing and Cases Increasing but Daily Deaths Decreasing
本文由‘中国推动’学者、济南大学生命科学学院生物技术专业任紫豪同学编辑整理。
Welcome to another MedCram COVID-19 update. Now in the news there’s been some discussion about a resurgence of COVID-19, especially in the United States. But of course, it’s different everywhere depending on which state you’re living in. And if you’re living outside of the United States, it can also be tricky or interesting to find out whether or not there’s a surge occurring in your region.
And for that I wanted to point out the testing tab here at the Johns Hopkins coronavirus Resource Center. So if you go here to testing at the top you’ll see here this is the Johns Hopkins COVID-19 Testing Insights Initiative. And there’s a number of tools here. What I wanted to draw your attention to is the Testing Insights: Tracking and Analysis. And here you can go to individual states, states comparison, testing positivity or international comparisons.
Here we’re going to go first to individual states. And what this show is on a state-by-state basis is how many total daily virus tests are being conducted in each state and how many of those tests are positive. So we’ll give you a positive index or positive percentage and there is a running seven day total. So for instance, let’s go down here. And you’ll see for the entire United States, how many tests were being done before March 29th? And how many have been done on a daily basis since that time. And also show you here in the dark yellow at the bottom, how many were actually positive of those tests?
So you can see here that we have done a lot of testing here in the United States and we’re testing more people than ever before. And as a result of that we’re catching more and more people, but the number of people that were catching on a daily basis has really not changed as a total in the United States. And as a result of that you can see this line is a percentage of the daily tests that were positive and you can see here that where we are currently as add a positive rate overall in the United States of 4.6%. And that’s the seven day moving average.
There is some guidance that comes from the WHO. They say here that the WHO has said that in countries that have conducted extensive testing for COVID-19. They should remain at 5% or lower for at least 14 days. That’s the positive percentage rate. They say here that if a community’s positivity is high, it suggests that the community made a largely be testing the sickest patients and possibly missing milder or asymptomatic cases.
Importantly it also says here that this initiative relies upon publicly available data from multiple sources and that states are not consistent in how and when they release an update their data and some may even retroactively change the numbers that they report. This can affect the percentages that you see presented in the data visualizations. And they’re taking steps to account for these irregularities in how they present the information. So in light of that it’d be interesting to see particularly those states in the news that are the subject of increase surge and that would be particularly in Florida, Texas and Arizona. So let’s take a look.
Here’s Arizona. We can see here that testing has ramped up. But in addition to that we are also seeing here in dark yellow that the number of positive cases has also gone up. And you can see clearly that the percent is around 17.7%, far above 5%. And this would go along with what they’re experiencing Arizona right now, which is they are near or over capacity in terms of their ICU beds. If we take a look here at Texas, we see a similar situation. We see here that they’re doing a lot more testing which is good, but they’re also picking up a lot of COVID positive cases. And so our positive index is above 5% at 7.9%.
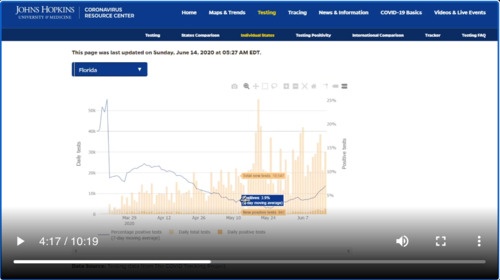
Okay, let’s take a look at Florida. You can see here that the number presented had gone down and reached an atar around late May, but since that time it’s been going up and that’s since Memorial Day. We can see here that positives are above 5% at 7.0% and testing seems to have come down slightly from its peak around the middle of May. So let’s go to the epicenter at the beginning of the pandemic in the United States- New York. You can see here clearly that New York has ramped up its testing to very high levels getting good data. And the number of positives is around 1.1%. So we’re not seeing a new surge here in New York.
Let’s also take a look at California. Again, we’re seeing a lot more testing being done. However, it looks as though in California that the positive rate is staying south of that 5% cut off. Let’s hope that stays as reality. Hawaii is another area that is being looked at. You can see here almost not reportable positives are at 0.9% and they’ve done some work here in terms of testing.
For those living outside the United States, we can go to international comparison and we can see here on a line that measures exactly where different countries are on this scattergram that looks at daily percentage of positive tests versus daily number of tests per hundred thousand population all time average.
Now interestingly, it says here that the United States has conducted more COVID-19 tests than any other country. However, there is no expert consensus on a recommended target for the raw number of tests or even the rate of test per capita. And the graph above demonstrates why using these statistics alone can be misleading. And the key message here is that testing program should be scaled to the size of their epidemic, not the size of the population. You can see here that the size of the circle is proportional to the daily confirmed new cases on average. Here’s that red line that we talked about the 5%. So I think this part of the website that we’ve linked to is going to be a helpful tool for individuals throughout the world in terms of what’s going on in their country and in their part of the country.
And speaking of global if we look at the daily new cases on worldometer will see that the daily new cases as at an all-time high overall. But yet when we look at daily deaths they seem to be decreasing. And what is it that can explain the fact that while more and more people all over the world of testing positive, the number of daily deaths are continuing to sort of decline. Of course the answer to that is only speculative, but may include the fact that we’re testing more people. It could also be that we’ve got better treatments in the hospitals.
Of course, all of these explanations are merely speculative, but we can only hope that the daily death trend continues to decrease. And of course one of those new drugs is dexamethasone. This is the steroid that was touted in the recently released trial out of Oxford that showed that dexamethasone reduced mortality by 35% in those patients on ventilators. Now, we have to be careful because this data has not been peer-reviewed and has not been published. And while we wait for that data to be published, there are signs of encouragement. In the treatment trial, they only use this steroid for 10 days either intravenously or orally.
Now when you use dexamethasone for 10 days, generally speaking, you’re not going to have the side effects such as osteoporosis, cataracts, diabetes and things of that nature. What you do have to worry about is whether or not your patient has a secondary infection. Obviously, the patient already has a primary infection that of a virus but that could also be secondary infections such as bacterial or fungal infections that are ongoing in the patient that’s ill.
In those patients that were not on oxygen but very very early in the course when they were given dexamethasone, there was no statistically significant increase or decrease in mortality, indicating that this medication dexamethasone, a corticosteroid is best used in patients who are further ondown the timeline of COVID-19 where there is cytokine storm as manifested by hypoxemia or a lack of oxygen. So this led the who director-general to say that this is the first treatment to be shown to reduce mortality in patients with COVID-19 requiring oxygen or ventilator support.
This is great news and I congratulate the government of the UK, the University of Oxford and the many hospitals and patients in the UK who have contributed to this life-saving scientific breakthrough. So I believe the good news here is that this is a very inexpensive medication as its off pattern. And unfortunately, though it’s not going to be a medication that you’re going to want to stockpile at home and try to take if you come down with coronavirus because it doesn’t seem to help unless you need to be on oxygen. And if you need to be on oxygen you probably should be in the hospital and not at home. And with that I just wanted to remind you that each country has its own story and you can follow that here at the Johns Hopkins coronavirus Resource Center. Thanks for joining us. We’ll see you next time.


Add comment