Antibody Testing False Positives in COVID-19 (Lecture 76)
本文由‘中国推动’学者、济南大学生命科学学院生物技术专业任紫豪同学编辑整理。
Welcome to another MedCram COVID-19 update. If we take a quick look at the states in the United States with the highest deaths per million population, we will see them listed here with New York, New Jersey, Connecticut, Massachusetts. These are basically the states of the Northeast. And as we go down we’ll run into this USA total which is kind of the average. And below that we have those states that are below average at least at this point.
If we take a look at Canada, we see that the daily new cases are starting to drop off as are the daily deaths in Canada. There’s been some concern made about what’s going on in Brazil. However, we see that the amount of cases have stopped increasing at least at this point in Brazil, or we can at least say that they have stabilized. And as we put it all together for the entire world, we can see or try to imagine that there is perhaps some sort of a leveling off there in terms of total deaths. But total cases seem to be rather linearly increasing.
So let’s take a little bit closer look at that. Let’s go back to New York, which had the highest cases per million. So if any state is approaching herd immunity, and I’m not saying that they’ve gotten there yet. But if any state would be there, it would be New York. And as we can see there, the daily new cases has dropped off that may be because of weather. It may be because of physical distance and that people are keeping away from each other. It’s going to be interesting to see what happens here with opening and whether or not these numbers increase towards the end of the fall and going into winter. And speaking of herd immunity, let’s talk a little bit about antibodies.
Recently, there was this article that was published by CNN Health titled, Antibody test for COVID-19 wrong up to half the time, the CDC says. And if you go to their website at the CDC, there is an article, Interim Guidelines for COVID-19 Antibody Testing. And we’ll cover that in just a second. But let’s go back to the CNN article and it all boils down to this line. They say in a population where the prevalence is 5% which is what it probably generally is in a number of places in the United States, a test with 90% sensitivity and 95% specificity will yield a positive predictive value of 49%. In other words, less than half of those testing positive will truly have antibodies. That’s a real problem because there’s a lot of false positives with that. So what is going on and how can we best understand that?
Well, to best understand it, you’ve got to understand exactly how we look at this as an epidemiologist or a medical student studying epidemiology. So let’s go back to medical school and the way that we typically look at this is we make a nice 2 by 2 square. And there’s two possibilities you either have the disease or you don’t have the disease. And we look at tests and we look at the specific test result and either you test positive or you don’t. So if you have the disease and you test positive for the disease, that’s known as a true positive. If you test positive for the disease and you don’t, that’s known as a false positive. If you have the disease and you test negative, that’s known as a false negative. And if you don’t have the disease and you test negative that’s known as a true negative.
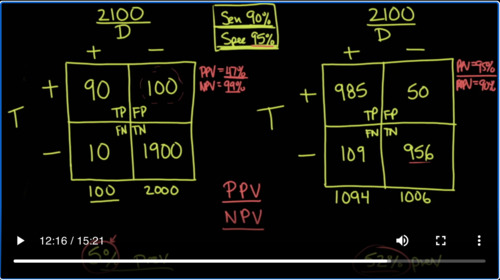
So what we want to do is let’s pretend that we take a town in America. And let’s say this town is a small town. It only has 2100 people in the population and we test everybody in the population. But the key here is that this is early on in the pandemic and so the prevalence of this disease is only 5%. So if the prevalence is only 5%, that means 100 people in the town have the disease and 2,000 people in the town don’t have the disease.
Now in addition to this, I want to say that we are going to use a test that has a sensitivity of 90% and a specificity of 95%. So what does that mean exactly, sensitivity and specificity? Well that has to do with people who have the disease and people who don’t have the disease. What do I mean by that? If a test is 90% sensitive, that means that the number of true positives divided by the number of people that have the disease in total is going to be 90%, specificity has to do with those that don’t have the disease. And what it says is those that are true negatives divided by the total number of people that don’t have the disease are going to be 95%.
So we can back calculate and figure out that the number that goes in here is 90, that this is 10, that this is 100 and this is 1900. So let’s do the math. 90 divided by the total number which is 100 is 90%. That’s the sensitivity. Notice that as the sensitivity goes up, the false negatives go down. And if the false negatives go down, that would mean that if you were to get a negative test result, it’s most likely going to be a true negative. Now conversely, let’s look at the specificity. The specificity here is 95%. What does that mean? That means that the true negatives divided by the total number of negatives is 95%. Notice that when the specificity goes up, the number of false positives goes down.
So that means if you end up getting a positive on a test, the chances are it’s going to be a true positive. And so because of that you can say that if something is very sensitive and it’s negative you can rule it out. But if something is very specific and it’s positive, then you can rule it in. So these are our test characteristics and we’re going to use those again.
Let’s take another snapshot of the same town except. A number of months later when our people have contracted the disease and the prevalence in the population has gone up. Instead of being 5% like it was in our first example, now we’re going to look at a prevalence of 52%. Still, the town has 2100 people. And again, we’re going to be looking at the same thing disease you either have it or you don’t and testing you either are positive or your negative.
Well, because 52% of the people of 2100 have the disease we can now know that instead of just 100 people having the disease, we have 1094 people having the disease. And therefore, we have 1006 people that don’t have the disease. Well again, we’re going to be using the same characteristics of sensitivity of 90% and specificity of 95%. And so we can fill in the numbers again. This is true positive, false positive, false negative, true negative. And the numbers go like this, 985 and 109, 50 and 956. If you take 985 and divided by 1094, you’re going to get the sensitivity of the test which is still 90%. If you take 956 and divide it by 1006, you’re going to get the specificity of the test, which is still 95%.
And so the sensitivity and the specificity has not changed in the first graph or the second graph. But the thing is when you order a test on a patient, you don’t really care necessarily what the sensitivity is or the specificity. What you’re interested in is if I get a positive result, what does this mean for this patient? And also if I get a negative result, what does this mean for this patient? In other words, if I get a positive or negative result, what are the chances that this patient either has or doesn’t have the disease.
To answer that question, you need to know the positive and negative predictive values, the positive predictive value and the negative predictive value. So in other words, the positive predictive value is given a positive test result, what are the chances this patient actually has the disease. And given a negative test result, what are the chances that this patient doesn’t have this disease. Well to do that, you actually have to go horizontal and so the positive predictive value is actually this number the true positives divided by the total number of positives and the negative predictive value is the true negatives divided by all of the negatives.
So let’s write that down. In this case here the positive predictive value is going to be 90 divided by 190 in which case that equals 47%. But if we look at the negative predictive value in this one, then it’s 1900 divided by 1910, which is a very high 99%. So when the prevalence is low at 5%, if you get a negative result on your antibody testing, there is a very good chance that it’s a true negative. However, if you get a positive result, when the prevalence in the population of COVID-19 is only 5%, then your positive predictive value the chances that you actually have really truly antibodies against COVID-19 is only 47%. And the reason why that’s the case is because there’s such a high amount of false positives.
The way you want to get the false positives down as we talked about is by picking a very specific test. And in this case, the specificity is only 95%. What you need is a specificity test of much higher value in order to have a positive predictive value that’s worth anything at all in this population. But now to show you how prevalence affects positive predictive value, we’re now going to go to our 52% prevalent population and do exactly the same thing.
So in this case we’re going to take 985 and divide it by the total number of positives which is 1035. And in this case, the positive predictive value is 95%. What does that mean? That when the prevalence is higher at 52% instead of just 5% and you get a positive value and you’re using exactly the same test. Now you’re much more confident that this positive test result actually means that you really do have antibodies against the virus. And the negative predictive value again is 956 true negatives divided by the total number of negatives which in this case is 1065. So when you do that, your negative predictive value is 90%, actually lower than it was when there was less prevalence.
So what we’ve just discovered here, is that prevalence determines positive and negative predictive values. A high prevalence will increase the positive predictive value, a low prevalence will increase the negative predictive value. So if we’re in a situation like this as we are right now where there’s a low prevalence as it stands here in May of 2020. Then the way to improve positive predictive value is to pick a test with a very high specificity. So let’s go back to the CDC website and see if what they’re saying makes sense and it says that the utility of test depends on the sensitivity and the specificity of the assays. These performance characteristics are determined by using a defined set of negative and positive samples. In addition, the predictive values of a test should be considered because these values affect the overall outcome of testing.
Positive predictive value that’s going across horizontally is the probability that individuals with positive test results are truly antibody positive, whereas negative predictive value is the probability that individuals with negative test results are truly antibody negative. Positive and negative predictive values are determined by the percentage of truly antibody positive individuals in the tested population.
Now notice what they say here. In a high prevalence setting that would be the one on the right that we did, the positive predictive value increases that’s exactly what we found- meaning it is more likely that persons who test positive are truly antibody positive- than if the test is performed in a population with low prevalence, remember that was the one on the left. When a test is used in a population where the prevalence is low, the positive predictive value drops because there are far more false positive results since the pretest probability is low.
What do they say we should do? Let’s look at testing strategies. Three strategies can be used to improve the positive predictive value. Choosing a test with a very high specificity, perhaps 99.5% or greater, will yield a high positive predictive value in populations tested with prevalence greater than 5%. And that’s exactly what we just said. The other thing you’d like to do is to focus your attention on testing people that have what they call a high pretest probability. For instance, our medical group is testing people in high pretest probability. So if they have a limited number of tests, they’re not going to be testing people who don’t have a high incidence of the disease by for instance, seeing people who may not be interacting with patients who have COVID-19, but instead testing intensive care physicians and hospitalists who are actually working in a COVID-19 unit. That would be the population with a higher prevalence and therefore it would make more sense to use antibody testing in that population.
I’ll let you read the rest of this article on the CDC website. It actually gives some very good information in terms of persons who test positive for anti SARS-CoV-2 antibodies. Thanks for joining us.


Add comment